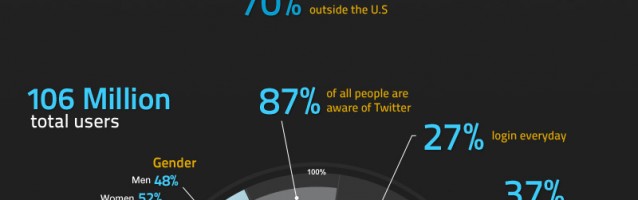
Facebook appeals to people looking to reconnect with old friends and family members or find new friends online; the mashup of features like email, instant messaging, image and video sharing, etc. feels familiar, while Twitter is a bit harder to get your arms around at first. Most people can very quickly grasp how to use Facebook to connect to friends…
Google Apps is one of the most popular cloud apps today. It is now used by both businesses and individuals to store critical data. Business-wise, Google Apps plays even more important role. Check this out: 20 percent of Google Docs users are having more than 350 documents stored in their Google Apps accounts. Moreover, 48 percent of Google Calendar users…
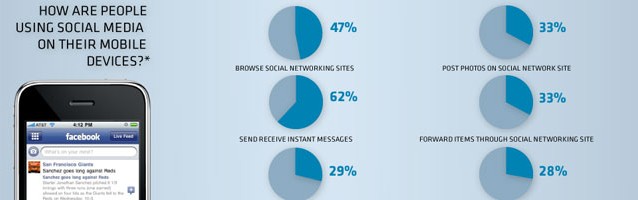
This is another interesting infographic, this time around how mobile is shaping the way social media is consumed. It’s interesting to see that from these stats, 25% or more than 100 million facebook users access from a mobile phone, and those who do, are twice as active on social networks compared to people accessing from a computer! The 35-54 year…
Microsoft Tag has just released a infographic highlighting statistics on how people are using mobile phones in 2011. The infographic shows that In 2014, mobile internet usage will overtake desktop internet usage and already in 2011, more than 50% of all “local” searches are done from a mobile device. Plus over 1 billion of the worlds 4+ billion mobiles phones are…
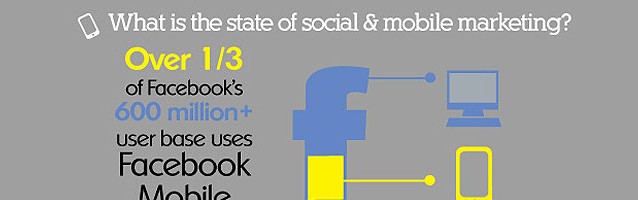
Is social media marketing effective? That’s the question being asked as more and more businesses are investing in increasing amounts of social media marketing. With no standard means of measurement, there’s a wide variety of goals and metrics used to define the ROI of social strategies. Fortunately, this enlightening infographic, developed by MDG Advertising, helps clear up the confusion by…
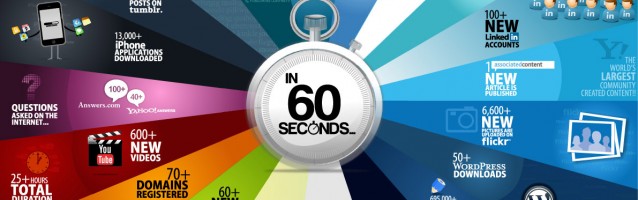
An infographic showing what happens online in 60 seconds. I have pulled out a few key stats: 695,000+ Facebook status updates. 98,000+ Tweets. 1,500+ Blog Posts. 20,000 New posts on Tumblr. 600+ New Videos on YouTube.
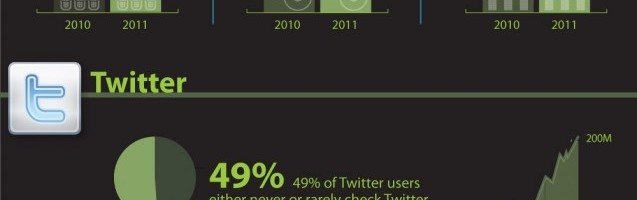
Everyone knows the growth of social media has been huge over the last 4 or 5 years, but what about in the last 12 months from 2010 – 2011? I have pulled out a few key statistics from the infographic: If Facebook were a country, it would be the world’s third largest country (about two times the size of the…